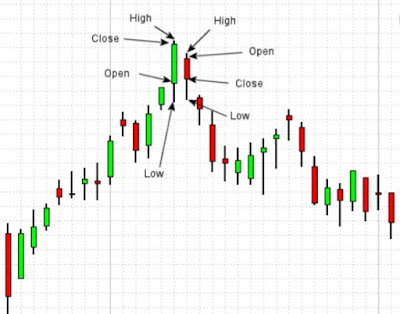
Sunday, 31 January 2021

DOUBLE BOTTOM PATTERN

How the pattern forms?


✍Double bottom is an intermediate to long-term reversal pattern that can takes a few candles to form. 

✍The trend reversal says itself there should be predefined trend before the pattern forms. 

✍Even though formation in a few candles is possible, it is preferable to have at least 4 to 5 weeks minimum between lows in a medium term. 

✍Double bottoms usually take longer than double tops to form and patience can often be a virtue.

✍A bottom is established and the neckline breaks, and then the pullback happens, which can act as a support for price. 

✍After a few weeks or months, the prices fall back to the previously established support, and form a double bottom, to rise again from these levels.

✍A letter "W" like formation is completed, and the stock can even surpass the previous resistances depending on the movement of index at that time.

✍Once double bottom was established, second positive breakout was witnessed when the prices crossed the second resistance level.


How to trade the double bottom?


✍The double bottom pattern should be traded on long or buy side on the end of downtrend or correction. 

✍The trade has to taken once the neckline is crossed and the breakout happens and the confirmation takes place.

✍The stop loss of the trade has to be put on low of pattern and target on the resistance level of price. 

✍The stoploss can be shifted upside once the higher low starts to form in an uptrend. 

✍Every pattern depends on "higher tops, higher lows" & "lower tops, lower lows". Double bottom is based on the once the higher high breaks and the uptrend starts. 

〰️〰️〰️〰️〰️〰️〰️〰️〰️〰️〰️〰️〰️〰️〰️〰️〰️〰️〰️〰️〰️〰️〰️〰️〰️〰️〰️〰️〰️〰️〰️

✔ Click to view TECHNICAL  ANALYSIS  FREE  COURSE

✔ Click to view STOCK  MARKET  FREE  COURSE

〰️〰️〰️〰️〰️〰️〰️〰️〰️〰️〰️〰️〰️〰️〰️〰️〰️〰️〰️〰️〰️〰️〰️〰️〰️〰️〰️〰️〰️〰️〰️〰️〰️

TO  OPEN  FREE  DEMAT  ACCOUNT  WITH  ANGEL  BROKING  INDIA WITH  LIFE  TIME  FREE  AMC  AND  ZERO  BROKERAGE  ON  DELIVERY. 

WHATSAPP ME

(👆CLICK TO WHATSAPP ME)

〰️〰️〰️〰️〰️〰️〰️〰️〰️〰️〰️〰️〰️〰️〰️〰️〰️〰️〰️〰️〰️〰️〰️〰️〰️〰️〰️〰️〰️〰️〰️〰️〰️

CONTACT  NUMBER :-

+919372633083

Friday, 29 January 2021

FALLING WEDGE

How the pattern forms?

✍The falling wedge is a bullish pattern that begins with wide channel and ends in small range. 

✍In falling wedge the formation of lower highs and lower bottoms is downtrend but the breakout above the previous high and resistance level reverses the trend. 

✍The channel formation in the falling wedge is wide at the beginning and goes on narrow at the end.

✍The formation of every pattern is depending upon tops and bottoms of price. The channel forming in the falling wedge is bullish in nature but confirms after the breakout. 

✍The reliability of this pattern depends upon the number of times the support and resistance has tested. The pattern is more reliable when the support and resistance is tested many times.


How to trade the falling wedge?

✍This pattern is traded in the buy or long side after the breakout above channel and closing above the previous high with the good volume.

✍While trading any price pattern one should wait for conformation in the pattern. 

✍The previous lows should be taken as a stoploss for this pattern. The target should be considered at next resistance level or highs in it.


✍As per the above image the pattern has tested support or resistance many times before the breakout. 

✍This pattern also indicates the end of downtrend and start of bull phase.

〰️〰️〰️〰️〰️〰️〰️〰️〰️〰️〰️〰️〰️〰️〰️〰️〰️〰️〰️〰️〰️〰️〰️〰️〰️〰️〰️〰️〰️〰️〰️〰️〰️

✔ Click to view TECHNICAL  ANALYSIS  FREE  COURSE

✔ Click to view STOCK  MARKET  FREE  COURSE

〰️〰️〰️〰️〰️〰️〰️〰️〰️〰️〰️〰️〰️〰️〰️〰️〰️〰️〰️〰️〰️〰️〰️〰️〰️〰️〰️〰️〰️〰️〰️〰️〰️

TO  OPEN  FREE  DEMAT  ACCOUNT  WITH  ANGEL  BROKING  INDIA WITH  LIFE  TIME  FREE  AMC  AND  ZERO  BROKERAGE  ON  DELIVERY. 

WHATSAPP ME

(👆CLICK TO WHATSAPP ME)

〰️〰️〰️〰️〰️〰️〰️〰️〰️〰️〰️〰️〰️〰️〰️〰️〰️〰️〰️〰️〰️〰️〰️〰️〰️〰️〰️〰️〰️〰️〰️〰️〰️

CONTACT  NUMBER :-

+919372633083

RISING WEDGE PATTERN

How the pattern forms ?

The rising wedge is a bearish price pattern that begins wide the bottom and narrows as prices move higher and the trading range shrinks at the top.

While it is a channel formation, the loss of upside momentum on each high gives the pattern its bearish sign. 

The series of higher highs and higher lows shows the bullish trend, which can make the pattern interpretation a bit difficult. 

The last stage of pattern is simply ones as the range narrows.

At the initial stage the identification of pattern is not possible, it clears after the formation is near to complete.

As the range broken downside the downtrend or correction begins.


How to trade the Rising wedge ?

This is more reliable in the case many times support and resistance is tested. If the number is low then then the reliability is less. 

The trade has to taken once the support and pervious low has broken with closing price and good volume.

In a short side trade the stop loss has to taken at the previous high of price and the target is t9he previous lows of the stock. 

Once the target is taken one can move the target at lower lows and stop loss should be shift accordingly


As you can see in the above image the price has tested many times support and resistance level

The downtrend begins after the breakdown of support.

〰️〰️〰️〰️〰️〰️〰️〰️〰️〰️〰️〰️〰️〰️〰️〰️〰️〰️〰️〰️〰️〰️〰️〰️〰️〰️〰️〰️〰️〰️〰️〰️〰️

✔ Click to view TECHNICAL  ANALYSIS  FREE  COURSE

✔ Click to view STOCK  MARKET  FREE  COURSE

〰️〰️〰️〰️〰️〰️〰️〰️〰️〰️〰️〰️〰️〰️〰️〰️〰️〰️〰️〰️〰️〰️〰️〰️〰️〰️〰️〰️〰️〰️〰️〰️〰️

TO  OPEN  FREE  DEMAT  ACCOUNT  WITH  ANGEL  BROKING  INDIA WITH  LIFE  TIME  FREE  AMC  AND  ZERO  BROKERAGE  ON  DELIVERY. 

WHATSAPP ME

(👆CLICK TO WHATSAPP ME)

〰️〰️〰️〰️〰️〰️〰️〰️〰️〰️〰️〰️〰️〰️〰️〰️〰️〰️〰️〰️〰️〰️〰️〰️〰️〰️〰️〰️〰️〰️〰️〰️〰️

CONTACT  NUMBER :-

+919372633083

Tuesday, 26 January 2021

INVERTED HEAD AND SHOULDER PATTERN

What is inverted head and shoulder pattern?

✍The head and shoulders pattern can sometimes be inverted. The inverted head and shoulder pattern is typically seen in the end of downtrends.

✍In an downtrend bears starts showing signs of weakness and the reversal happens.

✍The inverted head and shoulder pattern consists of left and right shoulder with middle head in it. The second shoulder is normally small in size as compared to first one.

✍The trend reversal pattern itself says the there should be predefined trend before the pattern forms. If the pattern forms without any predefined trend then the reliability is less.

✍The inverted head and shoulder pattern is based on simply "higher tops, higher bottoms" & " lower tops, lower bottoms". 

✍The higher low formation puts an end to downtrend and bulls starts dominating the price.


How the inverted head and shoulder forms?

Shoulder 1 - The  first shoulder is the part of downtrend and the pullback happens after it.

Head - The inverted head is the largest in the size compared to all three. The low the head is bottom of the stock and the end of downtrend. 

Shoulder 2 - The second shoulder formation is the higher low compared to head. It can face resistance at the neckline. 


How to trade inverted head and shoulder?

✍The inverted head and shoulder pattern should be trade at the bullish or long side trade.

✍The confirmation of the pattern takes place with the breakout of neckline with the large volumes and delivery percentage. 

✍The little consolidation before the breakout makes the pattern more clearer and reliable. 

✍The stoploss of the trade is the low of second shoulder and the target is double the size of head. 

✍If the small pullback takes place after the breakout neckline may act as a support level for price. In such case the stoploss should be shifted at the neckline. 

〰️〰️〰️〰️〰️〰️〰️〰️〰️〰️〰️〰️〰️〰️〰️〰️〰️〰️〰️〰️〰️〰️〰️〰️〰️〰️〰️〰️〰️〰️〰️〰️


✔ Click to view TECHNICAL  ANALYSIS  FREE  COURSE

✔ Click to view STOCK  MARKET  FREE  COURSE

〰️〰️〰️〰️〰️〰️〰️〰️〰️〰️〰️〰️〰️〰️〰️〰️〰️〰️〰️〰️〰️〰️〰️〰️〰️〰️〰️〰️〰️〰️〰️〰️〰️

TO  OPEN  FREE  DEMAT  ACCOUNT  WITH  ANGEL  BROKING  INDIA WITH  LIFE  TIME  FREE  AMC  AND  ZERO  BROKERAGE  ON  DELIVERY. 

WHATSAPP ME

(👆CLICK TO WHATSAPP ME)

〰️〰️〰️〰️〰️〰️〰️〰️〰️〰️〰️〰️〰️〰️〰️〰️〰️〰️〰️〰️〰️〰️〰️〰️〰️〰️〰️〰️〰️〰️〰️〰️〰️

CONTACT  NUMBER :-

+919372633083


Monday, 25 January 2021

HEAD AND SHOULDER PATTERN


What Is a Head And Shoulders Pattern?


✍A head and shoulders pattern is a price movement formation three peaks, the outside two are close in height and the middle is longest in price price terms. 

✍In technical analysis, a head and shoulders pattern describes a specific chart formation that predicts a reversal of price at the top. 

✍The head and shoulders pattern is considered as the most reliable trend reversal patterns. 


✍As you can see the above image the head and shoulder pattern has formed in it. The head and shoulder pattern is simply a lower top and lower bottom on the chart.

✍The head and shoulder pattern confirmation is the breakdown of neck line and closing below it.

✍What Head and Shoulders Patterns Looks Like

First, we'll look at the formation of the head and shoulders pattern and then the inverse head and shoulder pattern.

✍Formation of the pattern (seen at market tops):

Left shoulder: The first shoulder formation is the part of previous uptrend. The correction in the first shoulder is normal in price and the confirmation is not happened till that.

Head: Price grows again forming the higher top but the correction after it is little more in size.

Right shoulder: The third peck or last shoulder is small in size and forms the lower top.

In some times market may test the neckline as resistance after the fresh buying. 

The role of volume is greater in any pattern of price movement. The breakdown of neckline should be with higher volume. 


How to trade head and shoulder pattern?

The pattern confirms after the breakdown and trade has to taken after it.

The target of the pattern is almost equal to the height of head and the stoploss has to be put at the high of second shoulder. 

                              Next page

➖➖➖➖➖➖➖➖➖➖➖➖➖➖➖➖➖➖➖➖➖➖➖➖➖➖➖➖➖➖➖➖➖

✔ Click to view TECHNICAL  ANALYSIS  FREE  COURSE

✔ Click to view STOCK  MARKET  FREE  COURSE 

〰️〰️〰️〰️〰️〰️〰️〰️〰️〰️〰️〰️〰️〰️〰️〰️〰️〰️〰️〰️〰️〰️〰️〰️〰️〰️〰️〰️〰️〰️〰️〰️〰️

TO  OPEN  FREE  DEMAT  ACCOUNT  WITH  ANGEL  BROKING  INDIA WITH  LIFE  TIME  FREE  AMC  AND  ZERO  BROKERAGE  ON  DELIVERY. 

WHATSAPP ME

(👆CLICK TO WHATSAPP ME)

〰️〰️〰️〰️〰️〰️〰️〰️〰️〰️〰️〰️〰️〰️〰️〰️〰️〰️〰️〰️〰️〰️〰️〰️〰️〰️〰️〰️〰️〰️〰️〰️〰️

CONTACT  NUMBER :-

+919372633083

Sunday, 3 January 2021

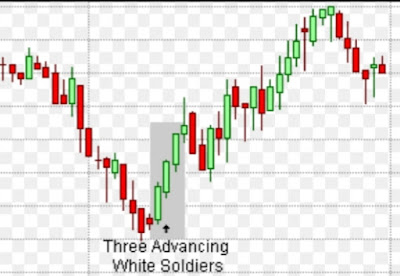
THREE WHITE SOLIDERS


✍The three white soldiers forms at the bottom of stock or index and act as a trend reversal in an upward direction. 

✍The morning star, marubozu or bullish engulfing can turn into three white soldiers in some cases

✍This is more reliable pattern as compared to other candles.

✍The first candle can be larger in size.

✍The third candle should not be small in size as compared to other three.

✍The volume of the three candles should be larger in number as compared to past volumes of the stock. 


PREVIOUS PAGE                             NEXT PAGE 

〰️〰️〰️〰️〰️〰️〰️〰️〰️〰️〰️〰️〰️〰️〰️〰️〰️〰️

       (Click  to  view 👆👆🥳)
〰️〰️〰️〰️〰️〰️〰️〰️〰️〰️〰️〰️〰️〰️〰️〰️〰️〰️
➖➖➖➖➖➖➖➖➖➖➖➖➖➖➖➖➖➖➖➖➖➖➖➖➖➖➖➖➖➖➖➖➖

✔ Click to view TECHNICAL  ANALYSIS  FREE  COURSE

✔ Click to view STOCK  MARKET  FREE  COURSE 

〰️〰️〰️〰️〰️〰️〰️〰️〰️〰️〰️〰️〰️〰️〰️〰️〰️〰️〰️〰️〰️〰️〰️〰️〰️〰️〰️〰️〰️〰️〰️〰️〰️

TO  OPEN  FREE  DEMAT  ACCOUNT  WITH  ANGEL  BROKING  INDIA WITH  LIFE  TIME  FREE  AMC  AND  ZERO  BROKERAGE  ON  DELIVERY. 

WHATSAPP ME

(👆CLICK TO WHATSAPP ME)

〰️〰️〰️〰️〰️〰️〰️〰️〰️〰️〰️〰️〰️〰️〰️〰️〰️〰️〰️〰️〰️〰️〰️〰️〰️〰️〰️〰️〰️〰️〰️〰️〰️

CONTACT  NUMBER :-

+919372633083

THREE BLACK CROWS


✍The three black crows is a trend reversal candlestick pattern forms at the top of uptrend. 

✍This pattern is more reliable and high success rate like marubozu or engulfing. 

✍The first bearish candle formation should be large size and high volumes. Other two candles should be small or medium in size.

✍The third candle should not be smallest among the three. 

✍The upper and lower shadows should always be small in size for all candles as compared to body of candle.

✍The stop loss should be put on the high of first candle it seems large in percentage but the target is larger than any other pattern. 


✍The evening star, marubozu or engulfing can turn into three black crows in most of cases.

✍As per shown in the above image the three black crows forms and the downtrend begins. 

PREVIOUS PAGE                           NEXT PAGE 

〰️〰️〰️〰️〰️〰️〰️〰️〰️〰️〰️〰️〰️〰️〰️〰️〰️〰️

       (Click  to  view 👆👆🥳)
〰️〰️〰️〰️〰️〰️〰️〰️〰️〰️〰️〰️〰️〰️〰️〰️〰️〰️
➖➖➖➖➖➖➖➖➖➖➖➖➖➖➖➖➖➖➖➖➖➖➖➖➖➖➖➖➖➖➖➖➖

✔ Click to view TECHNICAL  ANALYSIS  FREE  COURSE

✔ Click to view STOCK  MARKET  FREE  COURSE 

〰️〰️〰️〰️〰️〰️〰️〰️〰️〰️〰️〰️〰️〰️〰️〰️〰️〰️〰️〰️〰️〰️〰️〰️〰️〰️〰️〰️〰️〰️〰️〰️〰️

TO  OPEN  FREE  DEMAT  ACCOUNT  WITH  ANGEL  BROKING  INDIA WITH  LIFE  TIME  FREE  AMC  AND  ZERO  BROKERAGE  ON  DELIVERY. 

WHATSAPP ME

(👆CLICK TO WHATSAPP ME)

〰️〰️〰️〰️〰️〰️〰️〰️〰️〰️〰️〰️〰️〰️〰️〰️〰️〰️〰️〰️〰️〰️〰️〰️〰️〰️〰️〰️〰️〰️〰️〰️〰️

CONTACT  NUMBER :-

+919372633083

BEARISH INSIDE CANDLE


 ✍The bearish inside candle forms at the top of the uptrend in stocks/securities. 

✍The inside candle forms after the bullish candle is an indication of inside candle. The opening and closing of should be in the range of first candle. 

✍The formation of third bearish candle is confirmation of starting of downtrend or correction. 

✍The trade has to be taken once the confirmation takes place and the stop loss has to put at high of first candle.

✍The reliability or success rate of the inside candle is less as compared to other candles forms.

✍The trade has be taken once the confirmation happens and the stop loss has to follow strictly.


PREVIOUS PAGE                                    NEXT PAGE 
〰️〰️〰️〰️〰️〰️〰️〰️〰️〰️〰️〰️〰️〰️〰️〰️〰️〰️

       (Click  to  view 👆👆🥳)
〰️〰️〰️〰️〰️〰️〰️〰️〰️〰️〰️〰️〰️〰️〰️〰️〰️〰️
➖➖➖➖➖➖➖➖➖➖➖➖➖➖➖➖➖➖➖➖➖➖➖➖➖➖➖➖➖➖➖➖➖

✔ Click to view TECHNICAL  ANALYSIS  FREE  COURSE

✔ Click to view STOCK  MARKET  FREE  COURSE 

〰️〰️〰️〰️〰️〰️〰️〰️〰️〰️〰️〰️〰️〰️〰️〰️〰️〰️〰️〰️〰️〰️〰️〰️〰️〰️〰️〰️〰️〰️〰️〰️〰️

TO  OPEN  FREE  DEMAT  ACCOUNT  WITH  ANGEL  BROKING  INDIA WITH  LIFE  TIME  FREE  AMC  AND  ZERO  BROKERAGE  ON  DELIVERY. 

WHATSAPP ME

(👆CLICK TO WHATSAPP ME)

〰️〰️〰️〰️〰️〰️〰️〰️〰️〰️〰️〰️〰️〰️〰️〰️〰️〰️〰️〰️〰️〰️〰️〰️〰️〰️〰️〰️〰️〰️〰️〰️〰️

CONTACT  NUMBER :-

+919372633083

BULLISH INSIDE CANDLE


✍As the name suggest bullish inside candle forms inside the range of first candle which is bearish in nature. 

✍The inside candle also called as HARAMI CANDLE(Japanese language). This is an trend reversal candle which indicates there should be trend before the candle to reverse it.

✍The Inside candle forms at the bottom of the stocks/securities. The bullish candle forms after the inside candle is a confirmation of the trend reversal. 

✍The stop loss has to be taken on the low of first candle. The reliability or success rate of inside candle is less as compared to other forms. 

✍The target for this should be set on the price movement basis of support or resistance or any trend reversal candle at the top. 

✍The trade has to take only with confirmation only and strictly stop loss has to be follow. Candle can be used on any time frame but the reliability is higher in larger time frame such as daily, weekly and monthly. 


PREVIOUS PAGE                              NEXT PAGE 

〰️〰️〰️〰️〰️〰️〰️〰️〰️〰️〰️〰️〰️〰️〰️〰️〰️〰️

       (Click  to  view 👆👆🥳)
〰️〰️〰️〰️〰️〰️〰️〰️〰️〰️〰️〰️〰️〰️〰️〰️〰️〰️
➖➖➖➖➖➖➖➖➖➖➖➖➖➖➖➖➖➖➖➖➖➖➖➖➖➖➖➖➖➖➖➖➖

✔ Click to view TECHNICAL  ANALYSIS  FREE  COURSE

✔ Click to view STOCK  MARKET  FREE  COURSE 

〰️〰️〰️〰️〰️〰️〰️〰️〰️〰️〰️〰️〰️〰️〰️〰️〰️〰️〰️〰️〰️〰️〰️〰️〰️〰️〰️〰️〰️〰️〰️〰️〰️

TO  OPEN  FREE  DEMAT  ACCOUNT  WITH  ANGEL  BROKING  INDIA WITH  LIFE  TIME  FREE  AMC  AND  ZERO  BROKERAGE  ON  DELIVERY. 

WHATSAPP ME

(👆CLICK TO WHATSAPP ME)

〰️〰️〰️〰️〰️〰️〰️〰️〰️〰️〰️〰️〰️〰️〰️〰️〰️〰️〰️〰️〰️〰️〰️〰️〰️〰️〰️〰️〰️〰️〰️〰️〰️

CONTACT  NUMBER :-

+919372633083

Saturday, 2 January 2021

SANDWICH CANDLESTICK PATTERN


✍The sandwich pattern formation on the chart can be bullish trend reversal or bearish also. It may act as trend continuation pattern in some cases. 

✍Sandwich pattern can form also at the top or bottom of the trend. This pattern indicates the stock is in the specific range for the time and breakout or breakdown can happen with the range.


✍As you can see in the above image the sandwich pattern can be more than three candles. The high and low the range specified in it. The trade has to taken on breakout or breakdown. 


✍The sandwich pattern forms in the trend can also act as a trend continuation pattern which can also be flag pattern in price movement. 

〰️〰️〰️〰️〰️〰️〰️〰️〰️〰️〰️〰️〰️〰️〰️〰️〰️〰️

       (Click  to  view 👆👆🥳)
〰️〰️〰️〰️〰️〰️〰️〰️〰️〰️〰️〰️〰️〰️〰️〰️〰️〰️
➖➖➖➖➖➖➖➖➖➖➖➖➖➖➖➖➖➖➖➖➖➖➖➖➖➖➖➖➖➖➖➖➖

✔ Click to view TECHNICAL  ANALYSIS  FREE  COURSE

✔ Click to view STOCK  MARKET  FREE  COURSE 

〰️〰️〰️〰️〰️〰️〰️〰️〰️〰️〰️〰️〰️〰️〰️〰️〰️〰️〰️〰️〰️〰️〰️〰️〰️〰️〰️〰️〰️〰️〰️〰️〰️

TO  OPEN  FREE  DEMAT  ACCOUNT  WITH  ANGEL  BROKING  INDIA WITH  LIFE  TIME  FREE  AMC  AND  ZERO  BROKERAGE  ON  DELIVERY. 

WHATSAPP ME

(👆CLICK TO WHATSAPP ME)

〰️〰️〰️〰️〰️〰️〰️〰️〰️〰️〰️〰️〰️〰️〰️〰️〰️〰️〰️〰️〰️〰️〰️〰️〰️〰️〰️〰️〰️〰️〰️〰️〰️

CONTACT  NUMBER :-

+919372633083

FALLING THREE METHODS


✍Falling three methods candlesticks pattern forms between the mid of downtrend. It is trend continuation pattern rather than trend reversal. 

✍The first bearish candle formation at the trend and the three small candles or dojis are formed against the trend.

✍The fifth and last candle formation covers all the whole move of small candles and the downtrend continues. 

✍The three candles formed never retraces the whole first candle but the fifth candle always covers all the move three candles.

✍The trade has to be taken on the sell side and the stop loss has to be taken on the high of first candle. 


PREVIOUS PAGE                              NEXT PAGE 

〰️〰️〰️〰️〰️〰️〰️〰️〰️〰️〰️〰️〰️〰️〰️〰️〰️〰️

       (Click  to  view 👆👆🥳)
〰️〰️〰️〰️〰️〰️〰️〰️〰️〰️〰️〰️〰️〰️〰️〰️〰️〰️
➖➖➖➖➖➖➖➖➖➖➖➖➖➖➖➖➖➖➖➖➖➖➖➖➖➖➖➖➖➖➖➖➖

✔ Click to view TECHNICAL  ANALYSIS  FREE  COURSE

✔ Click to view STOCK  MARKET  FREE  COURSE 

〰️〰️〰️〰️〰️〰️〰️〰️〰️〰️〰️〰️〰️〰️〰️〰️〰️〰️〰️〰️〰️〰️〰️〰️〰️〰️〰️〰️〰️〰️〰️〰️〰️

TO  OPEN  FREE  DEMAT  ACCOUNT  WITH  ANGEL  BROKING  INDIA WITH  LIFE  TIME  FREE  AMC  AND  ZERO  BROKERAGE  ON  DELIVERY. 

WHATSAPP ME

(👆CLICK TO WHATSAPP ME)

〰️〰️〰️〰️〰️〰️〰️〰️〰️〰️〰️〰️〰️〰️〰️〰️〰️〰️〰️〰️〰️〰️〰️〰️〰️〰️〰️〰️〰️〰️〰️〰️〰️

CONTACT  NUMBER :-

+919372633083

RISING THREE METHODS


✍The rising three methods is trend continuation pattern rather than trend reversal.

✍It has formed at the mid of bullish trend. It indicates that the trend is in continuation form.

✍The first bullish candle formation at the trend and the three small candles or dojis forms against the trend.

✍The final candle formation covers whole fall of the three candles in a single move.

✍The volume of last candle should be good enough as compare to past volumes of stock. 


✍As per shown in the above image the pattern has formed in the mid of trend and act as a trend continuation for the bull trend.

✍The bullish position should be hold in this and the stop loss has to be shifted on the low of last candle.

PREVIOUS PAGE                           NEXT PAGE 

〰️〰️〰️〰️〰️〰️〰️〰️〰️〰️〰️〰️〰️〰️〰️〰️〰️〰️

       (Click  to  view 👆👆🥳)
〰️〰️〰️〰️〰️〰️〰️〰️〰️〰️〰️〰️〰️〰️〰️〰️〰️〰️
➖➖➖➖➖➖➖➖➖➖➖➖➖➖➖➖➖➖➖➖➖➖➖➖➖➖➖➖➖➖➖➖➖

✔ Click to view TECHNICAL  ANALYSIS  FREE  COURSE

✔ Click to view STOCK  MARKET  FREE  COURSE 

〰️〰️〰️〰️〰️〰️〰️〰️〰️〰️〰️〰️〰️〰️〰️〰️〰️〰️〰️〰️〰️〰️〰️〰️〰️〰️〰️〰️〰️〰️〰️〰️〰️

TO  OPEN  FREE  DEMAT  ACCOUNT  WITH  ANGEL  BROKING  INDIA WITH  LIFE  TIME  FREE  AMC  AND  ZERO  BROKERAGE  ON  DELIVERY. 

WHATSAPP ME

(👆CLICK TO WHATSAPP ME)

〰️〰️〰️〰️〰️〰️〰️〰️〰️〰️〰️〰️〰️〰️〰️〰️〰️〰️〰️〰️〰️〰️〰️〰️〰️〰️〰️〰️〰️〰️〰️〰️〰️

CONTACT  NUMBER :-

+919372633083
DARK CLOUD CANDLESTICK


✍This candlestick pattern forms at the top during the end of uptrend and indicates the trend reversal at the top.

✍The first bullish candle formation at the top and the second bearish candle is formed following that. 

✍The second day candle opening is gap up opening and the closing of the second candle is 50% or more than lower to first candle. 

✍The trade has to be taken on the third candle formation which is bearish.

✍The stop loss has to be taken on high of second candle.


✍As per shown in the above image the dark cloud cover candle has formed and the downtrend  begins after it.

✍The third opening gap down and the bearish closing is the confirmation of the trend reversal. 

PREVIOUS PAGE                         NEXT PAGE 

〰️〰️〰️〰️〰️〰️〰️〰️〰️〰️〰️〰️〰️〰️〰️〰️〰️〰️

       (Click  to  view 👆👆🥳)
〰️〰️〰️〰️〰️〰️〰️〰️〰️〰️〰️〰️〰️〰️〰️〰️〰️〰️
➖➖➖➖➖➖➖➖➖➖➖➖➖➖➖➖➖➖➖➖➖➖➖➖➖➖➖➖➖➖➖➖➖

✔ Click to view TECHNICAL  ANALYSIS  FREE  COURSE

✔ Click to view STOCK  MARKET  FREE  COURSE 

〰️〰️〰️〰️〰️〰️〰️〰️〰️〰️〰️〰️〰️〰️〰️〰️〰️〰️〰️〰️〰️〰️〰️〰️〰️〰️〰️〰️〰️〰️〰️〰️〰️

TO  OPEN  FREE  DEMAT  ACCOUNT  WITH  ANGEL  BROKING  INDIA WITH  LIFE  TIME  FREE  AMC  AND  ZERO  BROKERAGE  ON  DELIVERY. 

WHATSAPP ME

(👆CLICK TO WHATSAPP ME)

〰️〰️〰️〰️〰️〰️〰️〰️〰️〰️〰️〰️〰️〰️〰️〰️〰️〰️〰️〰️〰️〰️〰️〰️〰️〰️〰️〰️〰️〰️〰️〰️〰️

CONTACT  NUMBER :-

+919372633083


PIERCING CANDLESTICKS


✍Piercing candlestick is an indication that the downtrend is at the end and uptrend is near to start

✍At the end of downtrend bearish candle forms and the large bullish candle forms after it at second day.

✍The bullish candle forms on the second day should be the gap down opening and closing should above the 50% of first candle.

✍The trade has to be taken on the third day closing basis. The third day has to be bullish candle for taking trade and stop loss has to be taken on the low of second bullish candle. 

✍Piercing pattern is more reliable pattern. The success rate is higher in this candle.

✍The candlestick pattern is effective on any time frame but the success rate is higher in larger time frame than small ones.

✍As shown in the above image after the formation of piercing pattern the bullish candle forms after it and the trade has to taken after it.

PREVIOUS PAGE                           NEXT PAGE 

〰️〰️〰️〰️〰️〰️〰️〰️〰️〰️〰️〰️〰️〰️〰️〰️〰️〰️

       (Click  to  view 👆👆🥳)
〰️〰️〰️〰️〰️〰️〰️〰️〰️〰️〰️〰️〰️〰️〰️〰️〰️〰️
➖➖➖➖➖➖➖➖➖➖➖➖➖➖➖➖➖➖➖➖➖➖➖➖➖➖➖➖➖➖➖➖➖

✔ Click to view TECHNICAL  ANALYSIS  FREE  COURSE

✔ Click to view STOCK  MARKET  FREE  COURSE 

〰️〰️〰️〰️〰️〰️〰️〰️〰️〰️〰️〰️〰️〰️〰️〰️〰️〰️〰️〰️〰️〰️〰️〰️〰️〰️〰️〰️〰️〰️〰️〰️〰️

TO  OPEN  FREE  DEMAT  ACCOUNT  WITH  ANGEL  BROKING  INDIA WITH  LIFE  TIME  FREE  AMC  AND  ZERO  BROKERAGE  ON  DELIVERY. 

WHATSAPP ME

(👆CLICK TO WHATSAPP ME)

〰️〰️〰️〰️〰️〰️〰️〰️〰️〰️〰️〰️〰️〰️〰️〰️〰️〰️〰️〰️〰️〰️〰️〰️〰️〰️〰️〰️〰️〰️〰️〰️〰️

CONTACT  NUMBER :-

+919372633083

TRIPLE BOTTOM PATTERN

What is a Triple Bottom?  ✍A triple bottom is a bullish price pattern used in technical analysis that is identified by three same level lows...