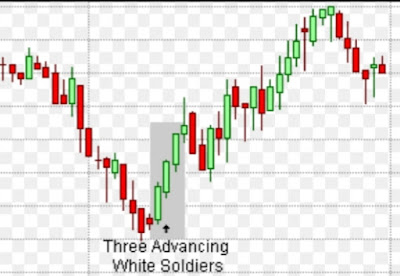
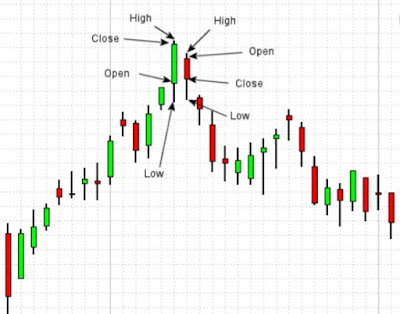
How the rounding bottom forms ?
✍A rounding bottom is a price pattern used in chart analysis and is identified by a movements that looks shape of a "U".
✍Rounding bottoms forms at the end of extended downward trends and confirms a reversal in long term price charts.
✍This chart time frame can vary from weeks to months and it is rare in case. Volumes plays an important role in confirmation of price action.
✍As it a long term trend reversal patterns it should be considered for more than one year of investment.
✍Rounding bottom pattern forms only in the stocks not on the indexes.
✍The stock price falls for the large and consolidated at the bottom and breakout takes place at end of it.
✍It can take several years to form the pattern and confirmation for it.
How to trade the rounding bottom pattern ?
✍The rounding bottom pattern should be traded on bullish side with a long term view on stock.
✍The stop loss has to be taken on the previous lows of the weekly candles on the chart.
✍The target of the stock is very high on the chart of the stock as it on the weekly and monthly time frame.
〰️〰️〰️〰️〰️〰️〰️〰️〰️〰️〰️〰️〰️〰️〰️〰️〰️〰️〰️〰️〰️〰️〰️〰️〰️〰️
✔ Click to view STOCK MARKET FREE COURSE
〰️〰️〰️〰️〰️〰️〰️〰️〰️〰️〰️〰️〰️〰️〰️〰️〰️〰️〰️〰️〰️〰️〰️〰️〰️〰️
TO OPEN FREE DEMAT ACCOUNT WITH ANGEL BROKING INDIA WITH LIFE TIME FREE AMC AND ZERO BROKERAGE ON DELIVERY.
(👆CLICK TO WHATSAPP ME)
〰️〰️〰️〰️〰️〰️〰️〰️〰️〰️〰️〰️〰️〰️〰️〰️〰️〰️〰️〰️〰️〰️〰️〰️〰️〰️
CONTACT NUMBER :-
+919372633083
〰️〰️〰️〰️〰️〰️〰️〰️〰️〰️〰️〰️〰️〰️〰️〰️〰️〰️〰️〰️〰️〰️〰️〰️〰️〰️


